CargoFax Trade Insights
U.S. Import Report September 2024
October 09, 2024

October 09, 2024
CargoFax presents the U.S. maritime import report for September 2024. This report covers key metrics such as shipments, containers, TEUs, and total tonnage, compared month-over-month (August 2024), year-over-year (September 2023), and year-to-date (January 1st - September 30th).
Additionally, the report highlights trends in commodities, trading partners, U.S. ports of entry, shipping lines, importers and exporters. Focusing exclusively on maritime imports, this analysis provides valuable insights into the dynamics of U.S. import flows.
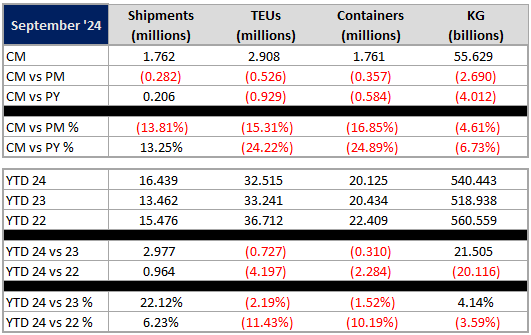
In September 2024, total import shipments reached 1.76 million, reflecting a 13.8% decline from August. Container volumes mirrored this downward trend, decreasing by 16.8% to 1.76 million containers. TEU volumes also dropped 15.3%, with 2.9 million TEUs processed. Additionally, the weight of imported goods decreased by 4.6%, totaling 55.6 billion kilograms. These figures indicate a general contraction in U.S. maritime import activity for the month.
Compared to the previous year, import shipments showed a 13.25% increase, signifying growth in shipment numbers. However, this rise contrasts with notable declines in other metrics: TEU volumes fell by 24.22%, container counts dropped by 24.89%, and the weight of imported goods decreased by 6.73%, reflecting a notable decrease in the mass of goods being imported despite the rise in shipments.
For the year-to-date (YTD), U.S. maritime imports presented mixed trends compared to the same period in 2023. Shipments grew by 22.12%, totaling 16.4 million. However, container volumes fell by 1.52%, reaching 20.1 million, while TEUs saw a slight decrease of 2.19%, with 32.5 million units recorded. Despite these declines, total tonnage increased by 4.14%, totaling 540.4 billion KG's.

In the following sections, we’ll focus primarily on TEUs as the key metric of analysis. However, if you’re interested in exploring additional dimensions like shipments, containers, or tonnage, CargoFax offers comprehensive access to these metrics and much more through our subscription plans.
Dive deeper into the data for detailed insights that can help optimize your business strategies.
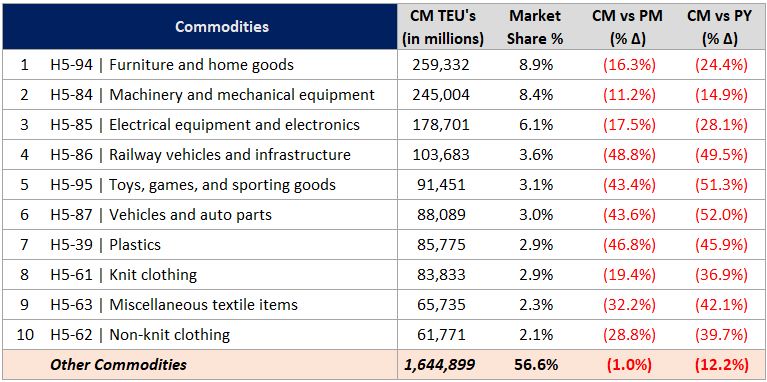
Grouping commodities by HS chapters, Furniture (HS-94) ranked as the top imported commodity, representing 8.9% of total imports. Appliances (HS-84) followed closely at 8.4%, and Electrical Machinery (HS-85) came in third with a 6.1% share.
Month-over-month, Apparel (HS-61), Vegetables (HS-07), and Wood Pulp (HS-47) recorded the most significant growth, rising by 6.5%, 6.4%, and 44%, respectively. In contrast, Appliances (HS-84), Furniture (HS-94), and Plastics (HS-39) showed declines, dropping by 11.2%, 16.3%, and 25.4%, respectively.
Additionally, Cotton (HS-52) saw a sharp 165% surge month-over-month, although its volume of 13.3K TEUs remained below the average 32K TEUs typically seen in most commodity chapters.
For detailed insights into which commodities were imported by specific companies or countries, the complete dataset is available through a CargoFax subscription.
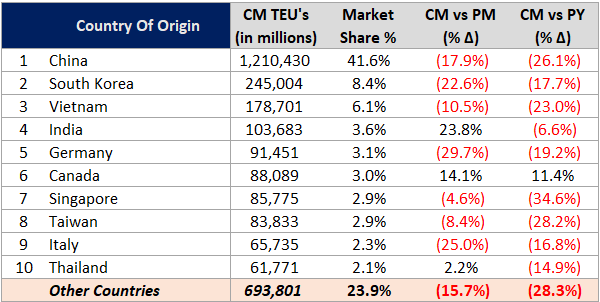
China remained the dominant country of origin, accounting for 41.6% of total U.S. TEU imports with over 1.2 million TEUs exported into the U.S. in September. South Korea and Vietnam followed, contributing 8.4% and 6.1%, respectively. India and Germany completed the top five, with 3.6% and 3.1% shares.
India showed the most significant increase in imports to the U.S., with a 23.8% rise compared to the previous month. Germany, however, saw a notable decline of 29.7%, making it the country with the largest decrease among the top 10 export countries.
The Port of Long Beach and Los Angeles led the nation in TEU volume, processing 470.7K and 449.2K TEUs, respectively. Both ports recorded significant declines compared to the previous month, with drops of 18.7% and 35.1%. The Port of New York and New Jersey followed, handling 439.7K TEUs, down 15.4% from the previous month. Savannah and Houston rounded out the top five ports, with 258K and 218K TEUs processed.
While most major ports saw a decrease, a few ports experienced growth, including Norfolk, Tacoma, and Charleston, South Carolina. These ports averaged 151K TEUs and saw growth rates of 1.9%, 21.75%, and 5.1%, respectively.

MSC led the market with a 15.4% share of total imports, handling 447.8K TEUs. CMA CGM and Maersk followed with 13.9% and 10.4% shares, respectively. Matson Navigation Shipping showed the largest growth in volume, with a 52% increase month-over-month.
The top five shipping lines accounted for 58.2% of total TEU volumes, while the top 10 captured 85.6% of the U.S. import market.

For this analysis, freight forwarders like Ch. Robinson have been excluded to focus solely on the top importers and exporters for September.
Among U.S. importers, Dole Fresh Fruit Co. led with 18.7K TEUs, showing a 16.9% increase in shipments month-over-month. Ikea and LG Electronics were also prominent players in the U.S. import landscape for September.

On the exporter side, Chinese manufacturers continued to dominate, particularly in electronics and machinery sectors. The top five exporters for the month saw steady volumes, with some sectors showing month-over-month growth.

Looking for more detailed insights from this dataset? Whether you need to track specific trade routes, explore the commodities a particular company imports or exports, or identify the shipping lines moving auto parts from Europe to the U.S. East Coast—CargoFax has you covered. All this data is available exclusively to our subscribers.
While this report offers a macro view of U.S. import activity, our subscribers gain access to the full dataset—containing over 40 million Bills of Lading. You’ll be able to explore granular details on shipments, containers, TEUs, and tonnage, empowering you to make data-driven decisions, optimize your supply chain, and seize new opportunities in global trade. Plus, with unlimited downloads, integrating these insights into your own reporting systems is seamless.
Unlock the full potential of this data by signing up today!